Graphs for Thermal Energy Recovery (TER)
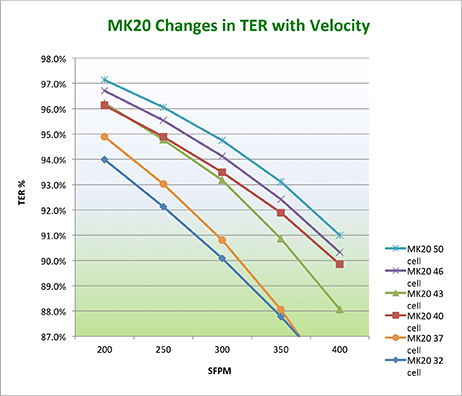
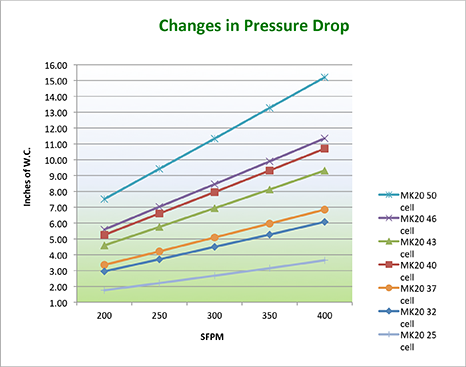
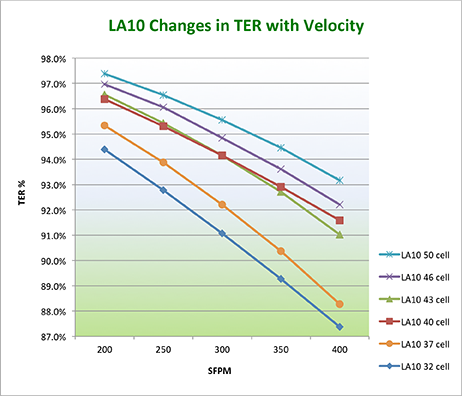
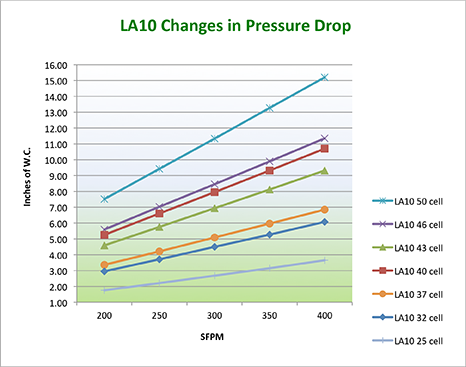
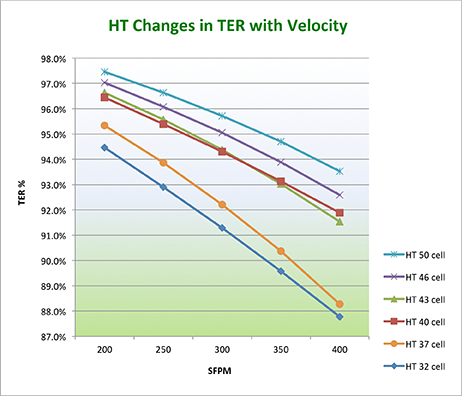
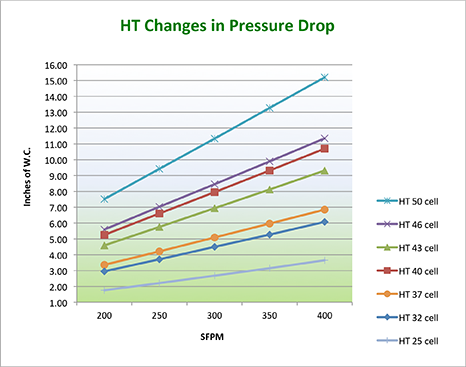
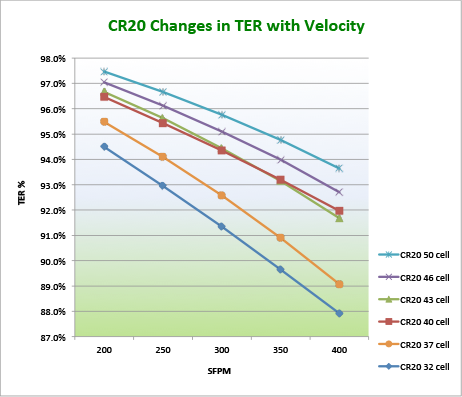
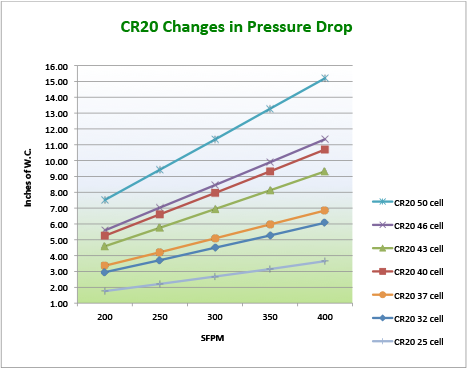
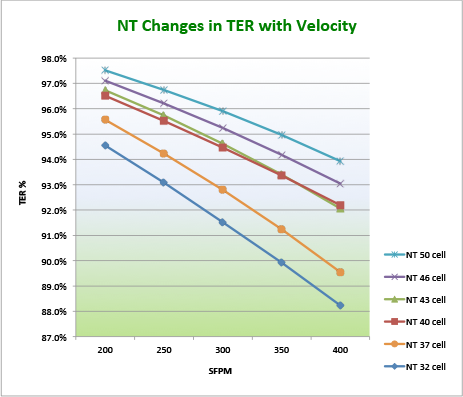
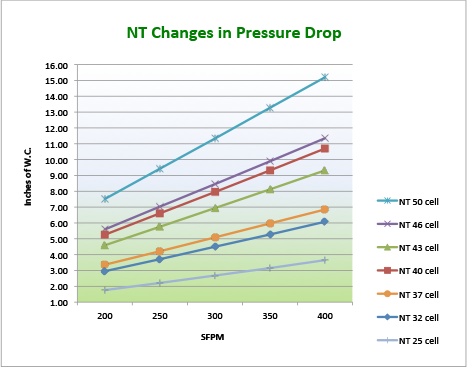
The Graphs for Thermal Energy Recovery (TER) vs bed velocity and Pressure drop VS Bed Velocity are used to show that as the face velocity increases through the media bed the TER goes down and the pressure drop goes up. These graphs help give you an idea of where performance will be for different bed velocities, block types, and cell structures and how each parameter affects the results. For customized results we need the exact working parameters of the unit which can be emailed or entered on the homepage and sent directly to us.
| Inputs | Standard |
|---|---|
| Combustion | 1500 F |
| Inlet | 100 F |
| Media Volume | 640 ft3 |
| Bed Size | 80 ft2 |
| Bed Height | 4 ft |
| Gas Volume | 24,000 |
| Cycle Times secs | 180 |
| SFPM | 300 |
| # of Canisters | 2 |
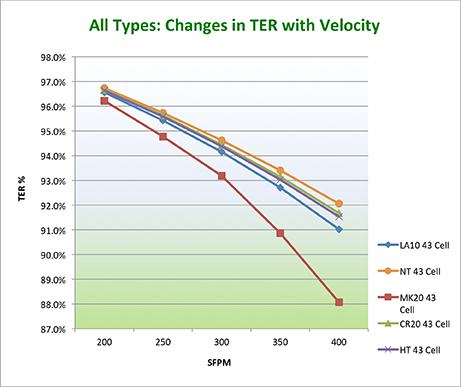
LA10 TER Graphs
HT TER Graphs
CR20 TER Graphs
NT TER Graphs
MK20 TER Graphs
